We’ve reached the point in our programming class where we’ve moved onto R. I couldn’t be happier. Why? Because now I can use functions. Let’s face it, I’m lazy and the less typing that I have to do the better.
Here’s a simple example.
Task: Create a histogram for twelve variables.
Solution: Write a function, create a vector of the variable names and pass that list to the function.

So yes, I could have copy and pasted the code creating the plot eleven times. (Ugh) But not only does that take longer, it also increases the likelihood that I’ll make a mistake.
Even better in R is the fact that there are many packages available that just make life easier. And when I say many, I mean M-A-N-Y. Packages are generally just a collection of functions written by someone else using base R. But for the lazy person like me they really save a ton of time AND can improve upon the results.
Here’s an example using the Psych package.
Task: Get the descriptive statistics for ten variables.
Hard Solution: Create a table of the numeric variables, use summary for the mean, median, min, max and quartiles. Use summarize_at for the total count and distinct count.

This yields output like this:


But thankfully, William Revelle at Northwestern University wanted to make exploratory data analysis easier and his team has been developing the psych package since 2005. While it was designed for Psychology data, it turns out it’s applicable to all sorts of data. Here’s how we get descriptive statistics in psych using the same table of numeric variables:

And here’s the nice looking output:
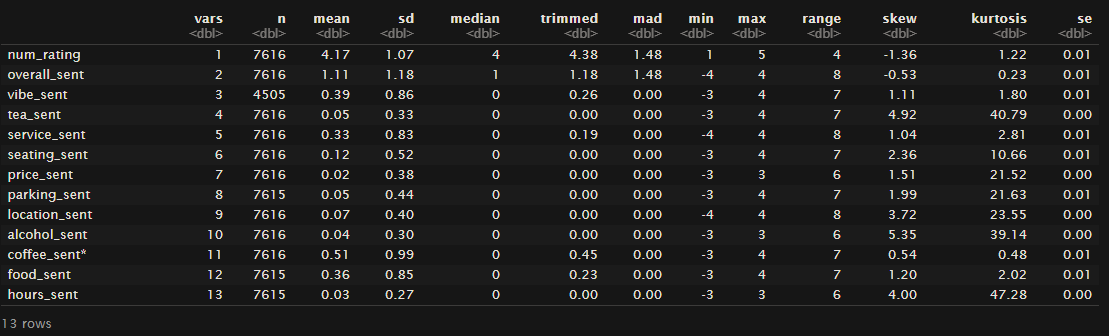
And yes, I could have done some gather and spread to get the nice table above (or written a function that iterated over the variables and then rbinded them together) using the first step. But that’s just too much work when I can simply type – describe(mydata).
Now one does have to be cautious with the plethora of packages out there. It’s usually a good idea to make sure that the package you are using is regularly updated. Always check the documentation. If you come across a package that hasn’t been updated in quite some time, it’s probably best to skip it. There is likely another package that does what you’re looking for anyway.
That’s all for this week. Just wait until we start discussing the graphics capabilities of R.
