
In addition to the ncaahoopR package in R, I had also been working on building a plot using Ken Pomeroy’s efficiency ratings. And voila! Here it is.
Unfortunately, WordPress doesn’t support the embedded interactive graphic. But if you visit my site on Plotly you’ll get the full experience.
What I’ve Done
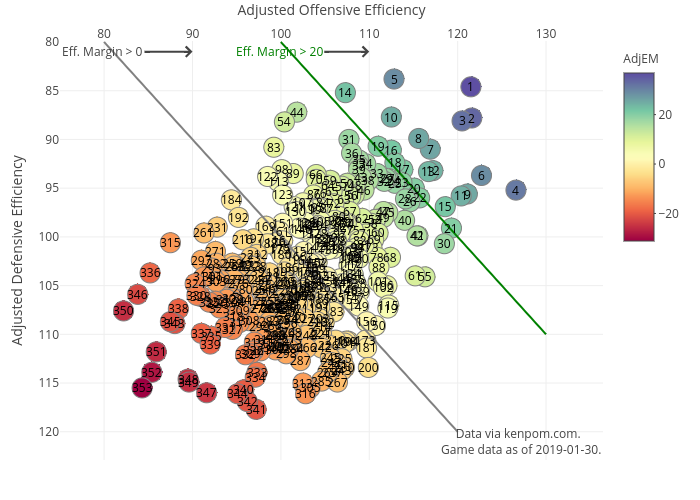
I’ve written an R script that scrapes the free data from Kenpom.com, and then created a Plotly scatter plot of every NCAA DI men’s basketball team with the offensive efficiency vs. the defensive efficiency. I flipped the y-axis and moved the x-axis to the top so that it’s very obvious that the best teams are in the top right quadrant and the worst in the bottom left.
Next, I shaded each each teams’ circle by the efficiency margin (off. eff. – def. eff.). Blue is very good, red is very bad. Then I increased the size of each dot and outlined it. Finally, I added their efficiency margin rank as the number (I just realized that I didn’t explain that on the chart).
I then added a couple of reference lines: 1) the gray line denotes an efficiency margin of 0. Anything to the right of the gray line has a positive margin, to left is negative (you don’t want your team to be to the left of the gray line). 2) The green line denotes an efficiency margin of 20. Any team to the right of this line historically indicates a legitimate Final Four contender. I also added a couple of annotations to explain those lines and an annotation to credit kenpom.com and indicate the date the data is valid through.
Finally, I added some information to the tooltip when you hover over a bubble. The tooltip includes Team Name and Record, Conference, Efficiency Margin and Efficiency Rank.
For the Future
I’ve already scaped NCAA.com to get the list of past national champions and started writing a function to get all the past years of Kenpom data. The goal is to add a set of gray bubbles indicating past national champions so you can see how this year’s contenders compare.
I also plan to add a select box with the list of conferences and add a transform that would highlight the teams from the selected conference and dim the others. This should be a great way to see how each conference stacks up.
Come tournament time, I also intend to add a checkbox to only show the tournament teams. So stay tuned. It should be fun!

D3 all the way. Just iframe it in
LikeLike
Once I learn D3…
LikeLike