PROC MEANS is SAS is a very useful function to get descriptive statistics for numeric variables in a dataset. There are a few R packages that approximate or even improve on PROC MEANS – psych, stats, skimr. But for practice with functions this week we wrote an R function that would give some of the functionality of PROC MEANS.
So we begin – it seemed the easiest (and fastest) way to solve this would be to place the column names in a vector, then create a vector for each of the statistics and use map_dbl from the purrr package to get the stats for each column in the original data set. Then format the vectors as a tibble. I used kableExtra to format the table. Here’s the code:

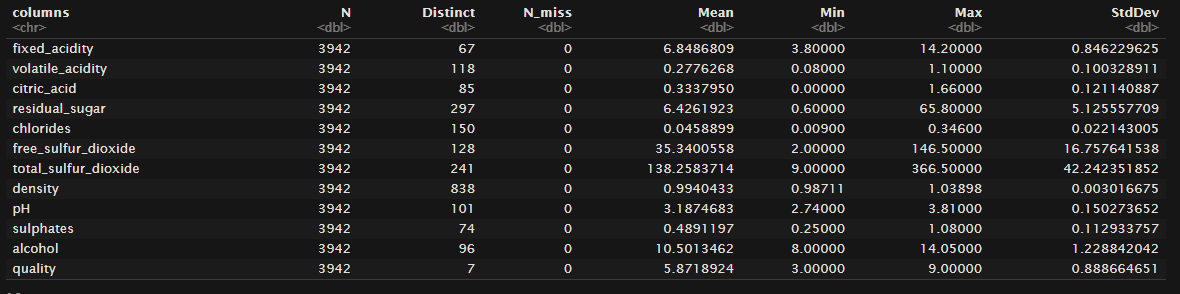
And here’s the kable for a data set on wine characteristics:

Nifty. But PROC MEANS allows you to set a character variable as a class and get the descriptive stats broken down by class. So that seemed like a bit more of a challenge. Time to add a new argument and a little bit of logic to get a little better detail of our data.

Ok. That should handle the default case where no class variable is passed as an argument. On to the case with a class argument. This is going to require a little more finessing. I want to be able to handle a class variable and not have to input the number of levels as sometimes we don’t know that before we attempt to get the descriptive stats.
We can use the same code as above to create the vectors since it worked so well (and quickly). It’s seems prudent to wrap that in a for loop, but we need to know the number of times to run the loop. So first we’ll need a vector of the unique values in the class argument. Then we can use that length of that vector to be the end of our range in the for loop. From there it’s all pretty easy.

I ran this on the wine data set with “type” as the class argument and got these two tables. The first is for red wines the second is for white.

Which brings up a point. I tried to use kable within the for loop as I’d like to have a title on the tables, but R would only output the last table created in the loop. I tried putting the tables into a list and calling them outside the loop, but then I was getting raw HTML as the result.
I’ll have to continue looking into more. I suspect I may have to put the vectors into a list and then create the tables outside the loop. We’ll see if that works later.
See you next week.
